

Notes from Underground: Last week's most popular stories and a horrifying chart on the world's debt
By Darren Atwater | Sunday 17 November 2019
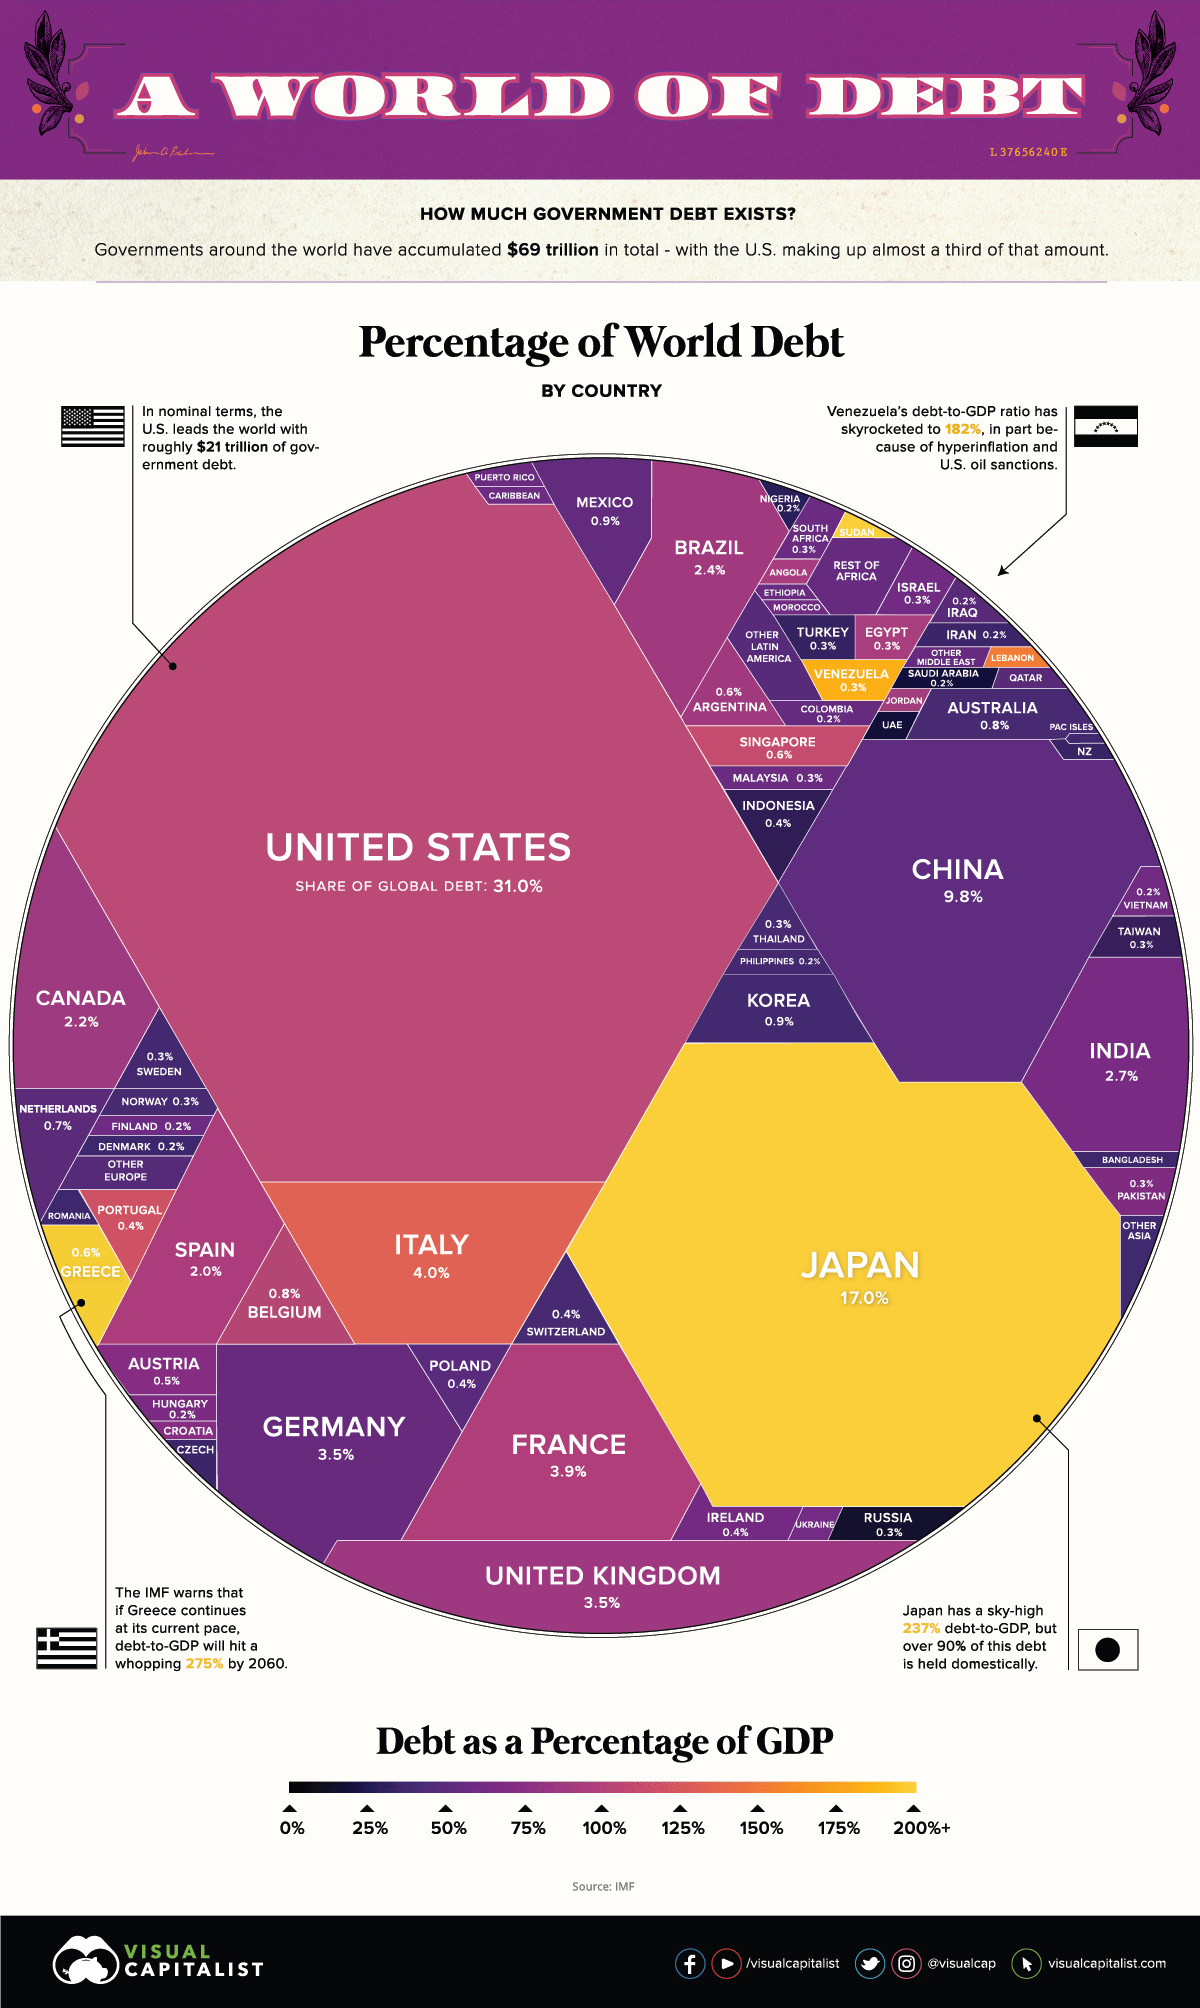
This chart, from Visual Capitalist, visualises the debt the countries of the world hold. Now, I'd be the first to say that if you issue your own currency, then so what? But you may beg to differ.
| Rank | Country | Debt to GDP | Gross Debt ($B) | % of World Total |
|---|---|---|---|---|
| #1 |  United States United States |
104.3% | $21,465 | 31.0% |
| #2 |  Japan Japan |
237.1% | $11,788 | 17.0% |
| #3 |  China, People's Republic of China, People's Republic of |
50.6% | $6,764 | 9.8% |
| #4 |  Italy Italy |
132.2% | $2,744 | 4.0% |
| #5 |  France France |
98.4% | $2,736 | 3.9% |
| #6 |  United Kingdom United Kingdom |
86.8% | $2,455 | 3.5% |
| #7 |  Germany Germany |
61.7% | $2,438 | 3.5% |
| #8 |  India India |
68.1% | $1,851 | 2.7% |
| #9 |  Brazil Brazil |
87.9% | $1,642 | 2.4% |
| #10 |  Canada Canada |
89.9% | $1,540 | 2.2% |
| #11 |  Spain Spain |
97.1% | $1,386 | 2.0% |
| #12 |  Mexico Mexico |
53.6% | $655 | 0.9% |
| #13 |  Korea, Republic of Korea, Republic of |
37.9% | $652 | 0.9% |
| #14 |  Australia Australia |
41.4% | $588 | 0.8% |
| #15 |  Belgium Belgium |
102.0% | $543 | 0.8% |
* * *
Our top 10 most-read stories this week were:
- The 5 most overvalued stocks on AIM according to Waseem Shakoor
- Tom Winnifrith – the 10 most overvalued stocks on AIM
- FCA Staff engaged in theft and shitting on floor as investors get hit by scandal after scandal
- You still cannot be Sirius - Strategic Review Progress Update
- Tern – portfolio update from Adam Reynolds’ Keyboard screams SELL! Tits up by Christmas!
- Eco Atlantic- Bad news on oil quality - SELL
- KEFI Minerals – financial and Tulu Kapi gold project updates… shares soar again; stance upgraded - target 6p
- Tissue Regenix – “very pleased” lender has “shown their support for the company”. Really?!...
- My Hero (again) Tim Martin of JD Wetherspoon lashes Corporate Governance woke Brigade, notably the Commie sociologist running charlatans PIRC
- Labour says it will close the #genderpaygap by 2030 - utter bollocks, my Bath Spa lecture
The most-listened to Bearcasts this week were:
- Tom Winnifrith – the 10 most overvalued stocks on AIM
- Tom Winnifrith Bearcast: the stupidity of investors, ref Sirius and Brady
- Tom Winnifrith Bearcast: Is Darren a drug crazed fiend? Jeff Prestridge sinks to a new low as he shames journalism ( as does the Sunday Times) over Woodford
- Tom Winnifrith Bearcast: Lucky Lord Lucan don't bludgeon the Angus share price to death, it's time to 'fess up
- Tom Winnifrith Bearcast: I really am going to have to go to the FRC about this one
- Tom Winnifrith Bearcast: ref Sound, is the whore blogger on drugs, brown envelopes or just plain stupid?
- Tom Winnifrith Bearcast: Explaining to a moron why I am not an insider dealer
This story is available to all readers
ShareProphets is reader-supported journalism
Become a member starting at £6.99 per month for all articles, the Bearcast, and our seven year archive.
Filed under:
Market News
Complete Coverage
Recent Comments
That Was the Week that Was
Thursday »
Vianet – emphasises contract win & trading momentum, but how much is already priced-in?…
- By Steven Moore
- 25 April 2024, 16:00
Tom Winnifrith Bearcast: What Argo Blockchain hides in the small print
- By Tom Winnifrith
- 25 April 2024, 15:47
Kromek – ‘pleased to receive’ new nuclear security contract, how pleasing really is it though?…
- By Steven Moore
- 25 April 2024, 13:59
Catenai – this is bonkers: Liam Murray on the funny fags again?
- By Tom Winnifrith
- 25 April 2024, 13:08
Trifast – “expected to be marginally ahead of guidance”. Er, that which was massively downgraded since its half-year?…
- By Steven Moore
- 25 April 2024, 11:02
Tern: is this an admission that it deceived investors (again) on 12 April?
- By Tom Winnifrith
- 25 April 2024, 10:30
Tom Winnifrith Bonus Bearcast: the Ariana Zimbabwe merger and M&A activity among gold miners, is it yet a frenzy?
- By Tom Winnifrith
- 25 April 2024, 10:05
Dispensa the last rats jump: a preview of how the frauds Supply and Regtech will fail
- By Tom Winnifrith
- 25 April 2024, 08:13
James Parsons given the order of the boot – Coro suspended: and there is more to come
- By Tom Winnifrith
- 25 April 2024, 08:12
Anglo American (#AAL) – all-share offer proposal from BHP Group, currently reviewing with its advisers
- By Steven Moore
- 25 April 2024, 07:55
Ariana Resources (#AAU) – conditional all-share agreement to acquire Rockover Holdings and to seek dual-listing on Australian Securities Exchange
- By Steven Moore
- 25 April 2024, 07:51
Argo Blockchain (#ARB) – 2023 even operating loss of $19.4m, notes Q1 2024 net debt of $41.6m
- By Steven Moore
- 25 April 2024, 07:48
London Stock Exchange (#LSEG) – Q1 adj. organic income +6.4% YoY, “on track to deliver all financial guidance”
- By Steven Moore
- 25 April 2024, 07:45
WH Smith (#SMWH) – H1 adj. EPS +5% to 24.4p, DPS up to 11p, “good start to the second half”
- By Steven Moore
- 25 April 2024, 07:41
Unilever (#ULVR) – Q1 “underlying sales” +4.4% YoY, FY outlook unchanged including “modest improvement in underlying operating margin”
- By Steven Moore
- 25 April 2024, 07:37
J Sainsbury (#SBRY) – FY adj. EPS -4% to 22.1p, DPS maintained at 13.1p, expects “profit leverage” in year ahead
- By Steven Moore
- 25 April 2024, 07:34
Persimmon (#PSN) – Q1 “in line with expectations”, recent “robust visitor numbers and enquiries”
- By Steven Moore
- 25 April 2024, 07:30
Ibstock (#IBST) – Q1 adj. EBITDA in line with expectations though only with cost reductions, argues recent lead indicators suggest some demand improvement
- By Steven Moore
- 25 April 2024, 07:27
Travis Perkins (#TPK) – Q1 revenue -4.9% YoY, -3.7% LFL, “macroeconomic uncertainty continues to impact demand”
- By Steven Moore
- 25 April 2024, 07:22
Wednesday »
ActiveOps – trading update, building on “strong foundations established since IPO”?
- By Steven Moore
- 24 April 2024, 16:05
Tom Winnifrith Bearcast: Dirty tricks by the Tirupati board or just a total moron?
- By Tom Winnifrith
- 24 April 2024, 15:22
SRT Marine Systems – “remains in line with market expectations”, what those which were recently downgraded? And now with possible problems in the Philippines…
- By Steven Moore
- 24 April 2024, 14:24
I’d be nervous ahead of Shield Therapeutics results on 30th April
- By Tom Winnifrith
- 24 April 2024, 13:02
Filtronic – trading and “strategic agreement” announcements, was I too cautious to have just had the shares on the watchlist?
- By Steven Moore
- 24 April 2024, 11:49
Tortilla Mexican – I just do not understand what Lucky Luke Johnson is playing at!
- By Tom Winnifrith
- 24 April 2024, 11:10
Anglo Asian Mining – Q1 update, expects to receive a transformative permit “shortly”
- By Steven Moore
- 24 April 2024, 09:36
Videndum – 2023 results, argues “strong” confidence in post-strikes recovery… but still currently below expectations!
- By Steven Moore
- 24 April 2024, 08:25
Capital Limited – Q1 update, an already winning share tip with further to go
- By Steven Moore
- 24 April 2024, 08:12
The Welsh just like being spanked by Nanny State at 20 mph – reports from the last village in Wales: Tom Winnifrith
- By Tom Winnifrith
- 24 April 2024, 08:00
Gear4music (#G4M) – FY sales -5%, argues reflects prioritisation of margins
- By Steven Moore
- 24 April 2024, 07:56
#JET2 – pleased with progress, but “recently, pricing has been more competitive”
- By Steven Moore
- 24 April 2024, 07:54
Nichols (#NICL) – Q1 revenue -5.9% YoY, argues still “well placed to deliver profitable growth”
- By Steven Moore
- 24 April 2024, 07:52
PZ Cussons (#PZC) – Q3 LFL revenue +6.4%, but at reported FX -23.7% “primarily as a result of the devaluation of the Nigerian Naira”
- By Steven Moore
- 24 April 2024, 07:47
Reckitt Benckiser (#RKT) – Q1 LFL net revenue +1.5% YoY, but more than offset by FX headwinds
- By Steven Moore
- 24 April 2024, 07:44
Bunzl (#BNZL) – Q1 LFL revenue -5.4% YoY, argues “strategic progress”
- By Steven Moore
- 24 April 2024, 07:41
abrdn (#ABDN) – Q1 AUMA up to £507.7bn, “actions underway to address outflows in Adviser and equities”
- By Steven Moore
- 24 April 2024, 07:36
Lloyds Banking Group (#LLOY) – Q1 net income -9% YoY and post-tax profit down to £1.2bn
- By Steven Moore
- 24 April 2024, 07:33
Breedon (#BREE) – Q1 LFL revenue -9% YoY, “economic landscape remains uncertain”
- By Steven Moore
- 24 April 2024, 07:27
Tuesday »
A failed fund manager insists Government Finances are in great shape whatever we doomsters say
- By ShareProphets
- 23 April 2024, 14:47
Tom Winnifrith Bearcast: is it racist to wish you a Happy St George's Day?
- By Tom Winnifrith
- 23 April 2024, 14:47
Ilika – “Capital Markets Day and Trading Update”, attempted ramptastic and cash burn?…
- By Steven Moore
- 23 April 2024, 14:09
Bluejay Mining, I am confused, surely it and disgraced Nomad SP Angel are not telling porkies (again)?
- By Tom Winnifrith
- 23 April 2024, 11:36
Roadside Real Estate (ex-Barkby Disaster) – Still Suspended (No Accounts) But A Bonkers Refinancing
- By Nigel Somerville
- 23 April 2024, 11:25
tinyBuild – 2023 results argue “has the capability to deliver over the coming years”. Does it though?…
- By Steven Moore
- 23 April 2024, 11:19
Avacta: Now just 43.75p and I am still sitting on the fence with Evil Banksta
- By Tom Winnifrith
- 23 April 2024, 11:11
Gold suffers largest 1 day drop in 14 months, "don't panic" says Ross Norman
- By Tom Winnifrith
- 23 April 2024, 11:01
Gotcha: 88 Energy ‘ fesses to placing at just 0.16p but it naturally misleads investors
- By Tom Winnifrith
- 23 April 2024, 10:39
Photo article: it's grim up North as Lucian ramps up the training
- By ShareProphets
- 23 April 2024, 09:20
Every Year this happens in the garden here at the Welsh Hovel - Tom Winnifrith
- By Tom Winnifrith
- 23 April 2024, 08:00
88 Energy (#88E) – proposed placing as per @tomwinnifrith, @shareprophets, but only “up to A$9.8 million” despite a 40% discount!
- By Steven Moore
- 23 April 2024, 07:59
Bens Creek (#BEN) – notes a General Meeting requisition “to discuss the operational and strategic challenges”
- By Steven Moore
- 23 April 2024, 07:55
Bens Creek (#BEN) – “debtor-in-possession” financing update following commencement of Chapter 11 Bankruptcy Court cases
- By Steven Moore
- 23 April 2024, 07:55
Jupiter Fund Management (#JUP) – Q1 AUM up to £52.6bn, but £1.6bn net outflows
- By Steven Moore
- 23 April 2024, 07:48
#RWS Holdings – expects H1 adj. PBT down to approx. £45m with some “ongoing headwinds”
- By Steven Moore
- 23 April 2024, 07:45
GB Group (#GBG) – expects FY adj. Op profit of approx. £61.2m, “driven by a focus on simplification and cost-effectiveness”
- By Steven Moore
- 23 April 2024, 07:42
Taylor Wimpey (#TW.) – notes net private sales 0.73 per outlet per week (2023: 0.75), states positioning for growth from 2025
- By Steven Moore
- 23 April 2024, 07:38
#THG – Q1 “continuing revenue” +4.5% constant currency, +2.1% actual YoY, expectations “remain unchanged”
- By Steven Moore
- 23 April 2024, 07:34
Associated British Foods (#ABF) – H1 EPS up to 87.4p, DPS to 20.7p, “on track to deliver… ahead of expectations”
- By Steven Moore
- 23 April 2024, 07:29
JD Sports Fashion (#JD.) – proposed acquisition of US sports fashion retailer Hibbett, Inc. for $1.11bn Enterprise Value
- By Steven Moore
- 23 April 2024, 07:24
Monday »
BREAKING: 88 Energy has been trying to get a A$20 million placing away - City Source
- By Tom Winnifrith
- 22 April 2024, 20:39
Mind Gym – emphasises “significantly improved second half performance”, but sufficiently improved for the valuation?…
- By Steven Moore
- 22 April 2024, 16:00
Tom Winnifrith Bearcast: No Comrade Brian Basham you are a crackpot commie and wrong about capitalism
- By Tom Winnifrith
- 22 April 2024, 14:53
The London Stock Exchange bats for More Lesbian Visibility or is it less?
- By ShareProphets
- 22 April 2024, 14:15
Made Tech – “awarded £19.5m new contract”. Is it to be £19.5m though and should it could command a near 46% share price rise?…
- By Steven Moore
- 22 April 2024, 13:25
Technology Minerals hooks up with a right Wanke – smoke and mirrors disposal, $10m my arse!
- By Tom Winnifrith
- 22 April 2024, 12:35
Aferian – “positioned… on the strongest possible foundation for the future”. Er, what about the trading warning, maturing banking facility & upcoming lack of CEO?!
- By Steven Moore
- 22 April 2024, 11:27
Tom Winnifrith Bonus Bearcast: the chatroom gerbils rush to defend bent CEO Russel Fryer of Critical Metals
- By Tom Winnifrith
- 22 April 2024, 11:12
Keep Selling Petrofac, the Shoe is Dropping this is free money!
- By Tom Winnifrith
- 22 April 2024, 11:00
Chill Brands CEO suspended on insider dealing allegation but is this all it seems?
- By Tom Winnifrith
- 22 April 2024, 10:14
Why is Russell Fryer not being fired as CEO of Critical Metals PLC?
- By Tom Winnifrith
- 22 April 2024, 08:50
Chill Brands (#CHLL) – CEO Callum Sommerton suspended, allegations “around the use of inside information”
- By Steven Moore
- 22 April 2024, 07:59
Hipgnosis Songs Fund (#SONG) – improved takeover proposal from Blackstone which “would be minded to recommend”, providing access to confirmatory due diligence
- By Steven Moore
- 22 April 2024, 07:53
Alliance Pharma (#APH) – “auditor, Deloitte LLP, has requested additional time to finalise”, 2023 results further delayed to “early May”
- By Steven Moore
- 22 April 2024, 07:48
Aferian (#AFRN) – “further deterioration in the trading of the Amino business”, “in advanced discussions with its lenders”
- By Steven Moore
- 22 April 2024, 07:44
#MIND Gym – emphasises H2 improvement, though “continuing to see delays in decision making and scaling back of projects”
- By Steven Moore
- 22 April 2024, 07:41
Cerillion (#CER) – H1 update, “strong demand… remains well-placed to meet market expectations”
- By Steven Moore
- 22 April 2024, 07:37
PayPoint (#PAY) – anticipates FY adj. pre-tax profit “in line with expectations”, share buyback programme “under active consideration”
- By Steven Moore
- 22 April 2024, 07:34
Elixirr International (#ELIX) – 2023 adj. EPS +22% to 37.2p, DPS +37% to 14.8p, “momentum has continued into FY24”
- By Steven Moore
- 22 April 2024, 07:27
#JTC – proposed $21m acquisition of trust administration services business from JPMorgan Chase Bank
- By Steven Moore
- 22 April 2024, 07:24
Sunday »
Tom Winnifrith Bearcast: DCI Advisors - dirt cheap shares or a £42m big fat Greek zero?
- By Tom Winnifrith
- 21 April 2024, 19:43
The View From The Montana Log-Cabin As Gold Presses $2,400 Again
- By Nigel Somerville
- 21 April 2024, 13:13
Just how stupid are some shareholders in Ben’s Creek? Words fail me
- By Tom Winnifrith
- 21 April 2024, 11:33
Sunday Long Reads: Rich People Don’t Eat, Smuggling into North Korea, Making of Modi, Woke Radio
- By ShareProphets
- 21 April 2024, 11:24
Notes from Underground – Most read articles for the week ending 20 April
- By ShareProphets
- 21 April 2024, 11:12
Saturday »
Tom Winnifrith Bearcast: cat update and Neil Woodford what he says is wrong and he just has no moral platform
- By Tom Winnifrith
- 20 April 2024, 20:47
Jubilee Metals – Q3 chrome record but PGM and copper production lower, still a STRONG risk reward BUY
- By Tom Winnifrith
- 20 April 2024, 19:20
With TV's, Washing Machines and Laptops Relishing a Probable Revival, Take a Gander at this Growing Online Telly Seller.
- By Malcolm Stacey
- 20 April 2024, 08:00
Mark Menzies: The Tory MP who “disputes” the Grindr blackmail misuse of funds reports – its like dealing with stockmarket villains, Tom Winnifrith
- By Tom Winnifrith
- 20 April 2024, 01:28
The cat and I both visit the doctors, it is my bank balance left writhing in agony - Tom Winnifrith
- By Tom Winnifrith
- 20 April 2024, 01:26
Friday »
Centamin – Q1 production lower, but a now production and sector recovery Buy
- By Steven Moore
- 19 April 2024, 16:50
Xeros Technology – “pleased to announce” retail offer closing result, fooling itself or trying to fool everyone else?
- By Steven Moore
- 19 April 2024, 16:20
Tom Winnifrith Bearcast: after Cheryl, I add Miss Israel, India and Iceland to the list
- By Tom Winnifrith
- 19 April 2024, 15:40
Nexus Infrastructure – argues half-year “good progress”, but how good really?…
- By Steven Moore
- 19 April 2024, 14:15
Tom Winnifrith Bonus Bearcast: I win at Sam Antar's game of fraudster
- By Tom Winnifrith
- 19 April 2024, 11:08
Alan Green and the Chill Brands loons on twitter, they just don’t get it!
- By Tom Winnifrith
- 19 April 2024, 10:09
B.P. Marsh & Partners – further upside from a winning share tip
- By Steven Moore
- 19 April 2024, 09:24
Video Exclusive: Sarah Willingham of Nightcap goes bonkers & accuses "obsessive" Tom Winnifrith of spreading fake news
- By ShareProphets
- 19 April 2024, 08:00
Photo Article: The pool opens at luxury and isolated Greek villa May 1 - now just eight weeks unbooked until November, Tom Winnifrith
- By Tom Winnifrith
- 19 April 2024, 08:00
Silverwood Brands (#SLWD) – delayed restoration of trading as awaits Capital Reduction Court order to be registered by the Registrar of Companies
- By Steven Moore
- 19 April 2024, 08:00
Novacyt (#NCYT) – DHSC Pre-Trial Review listed to be heard on 30th April, with also a DHSC application for summary judgment
- By Steven Moore
- 19 April 2024, 07:56
Bluejay Mining (#JAY) – intends to expand to include helium, industrial gases and hydrocarbons, attempted ramptastic
- By Steven Moore
- 19 April 2024, 07:52
Pensana (#PRE) – FSDEA loan facility extension discussions to tie-in with the anticipated finalisation of main financing
- By Steven Moore
- 19 April 2024, 07:51
#SDX Energy – agreement for sale of West Gharib asset for estimated $6.6m
- By Steven Moore
- 19 April 2024, 07:46
Quadrise (#QED) – Valkor project initial oil well expected to commence drilling next week
- By Steven Moore
- 19 April 2024, 07:43
Clean Power Hydrogen (#CPH2) – 2023 £4.1m loss, cash down to £8.5m
- By Steven Moore
- 19 April 2024, 07:37
Nexus Infrastructure (#NEXS) – H1 update, notes increased order book but “challenging market conditions persist”
- By Steven Moore
- 19 April 2024, 07:31
Man Group (#EMG) – Q1 net flows -$1.6bn, but AUM up to $175.7bn
- By Steven Moore
- 19 April 2024, 07:26
#888 Holdings – Q1 revenue -3% YoY, though emphasises “continuation of positive sequential quarter-on-quarter trends”
- By Steven Moore
- 19 April 2024, 07:22
Thursday »
Pod Point – “pleased to announce… ahead of guidance for revenue and adjusted EBITDA”. Er, what about the initial guidance though?!
- By Steven Moore
- 18 April 2024, 15:53
Tom Winnifrith Bearcast: Has Leon at Jubilee slipped up one time too many?
- By Tom Winnifrith
- 18 April 2024, 15:48
Video: Will the Dollar or Bond Market Be Sacrificed First in the Next Crisis?
- By Tom Winnifrith
- 18 April 2024, 13:34
Home REIT – surely it is having its cake and eating it as lawyers letters fly
- By Tom Winnifrith
- 18 April 2024, 13:11
CyanConnode – appointment of a joint broker “with immediate effect”. Why might that be?
- By Steven Moore
- 18 April 2024, 13:05
Horse Hill – time for Pennpetro and UK Oil & Gas to ‘fess, the farm in is not going to happen!
- By Tom Winnifrith
- 18 April 2024, 11:44
Another day and another Tory MP in a sex and corruption scandal – I think again of Christopher Booker of Private Eye and 1963, Tom Winnifrith
- By Tom Winnifrith
- 18 April 2024, 08:00
#HOME REIT – issued and received pre-action letters of claim, “intends vigorously to defend”
- By Steven Moore
- 18 April 2024, 07:59
Hipgnosis Songs Fund (#SONG) – $1.16 per share recommended offer from Concord Chorus
- By Steven Moore
- 18 April 2024, 07:58
AJ Bell (#AJB) – notes Q2 growth, platform market opportunity “remains significant”
- By Steven Moore
- 18 April 2024, 07:51
Carr's (#CARR) – H1 adj. EPS -4% to 4.8p, DPS up to 2.35p, process to “maximise shareholder value” from Engineering division
- By Steven Moore
- 18 April 2024, 07:48
Volex (#VLX) – expects FY adj. Op profit “slightly ahead of analyst expectations”
- By Steven Moore
- 18 April 2024, 07:44
easyJet (#EZJ) – expects H1 reduced adj. loss to £340m-£360m, demand “continues to build well for summer”
- By Steven Moore
- 18 April 2024, 07:42
Dunelm (#DNLM) – Q3 sales +3% YoY “driven by volume”, expects FY “broadly in line with market expectations”
- By Steven Moore
- 18 April 2024, 07:38
Rank (#RNK) – Q3 LFL net gaming revenue +6% YoY, expects FY in line with expectations
- By Steven Moore
- 18 April 2024, 07:35
Foxtons (#FOXT) – Q1 revenue +9% YoY, “trading in line with management's expectations”
- By Steven Moore
- 18 April 2024, 07:28
Deliveroo (#ROO) – Q1 gross transaction value +5% YoY, FY guidance maintained
- By Steven Moore
- 18 April 2024, 07:25
Wednesday »
It’s time to book your seats at Sharestock 2024 on September 7, now 50% sold out
- By Tom Winnifrith
- 17 April 2024, 16:04
Touchstar – 2023 results, “another period of improved financial performance” so why the share price fall in response?...
- By Steven Moore
- 17 April 2024, 16:03
Tom Winnifrith Bearcast: I just don't see the attraction of ASOS
- By Tom Winnifrith
- 17 April 2024, 15:58
Inspecs – 2023 results state “continuing to perform well”. Er, what about the end of year profit warning?!
- By Steven Moore
- 17 April 2024, 14:14
EXPOSE: Wyld – why is Tern exercising fewer T04 warrants than Jonathan Swann when it claims it has a much larger shareholding?
- By Tom Winnifrith
- 17 April 2024, 13:10
I'd be amazed if the GCM Resources Phulbari project ever gets sanctioned given the impact on the environment and local people - avoid
- By Gary Newman
- 17 April 2024, 11:43
Surface Transforms – “2024 Sales Outlook” down from just last week! And what about the balance sheet position that dare not speak its name again?
- By Steven Moore
- 17 April 2024, 11:28
Oxford Nanopore from £3.7 billion at IPO to £846 million, I'm massively vindicated but is it still a short?
- By Tom Winnifrith
- 17 April 2024, 11:23
The Supply@ME Capital and Regtech frauds see shares plunge to new lows, with endgame imminent does the Fat Lady speak Italian?
- By Tom Winnifrith
- 17 April 2024, 10:36
Non-disclosure: it’s what they are not saying but does anyone give a FF about the rules anymore?
- By Tom Winnifrith
- 17 April 2024, 09:44
The Cass Report – on the transgender walk of shame must be Bath Spa University: TomWinnifrith
- By Tom Winnifrith
- 17 April 2024, 08:00
Oxford University's Diversity Boss does not believe in free speech for those who engage in WrongThink - Tom Winnifrith
- By Tom Winnifrith
- 17 April 2024, 08:00
Scirocco Energy (#SCIR) – proposed AIM cancellation following rebel General Meeting succeeding
- By Steven Moore
- 17 April 2024, 07:59
Equals (#EQLS) – Takeover Panel further extension to 5pm 15th May, with discussions and due diligence “ongoing”
- By Steven Moore
- 17 April 2024, 07:59
Liontrust Asset Management (#LIO) – FY AuMA £27.8bn, Q4 net outflows £1.2bn
- By Steven Moore
- 17 April 2024, 07:56
Hunting (#HTG) – “positive start to the year… marginally ahead of management's expectations”
- By Steven Moore
- 17 April 2024, 07:52
Severfield (#SFR) – expects FY “slightly ahead of expectations”, “seeing an improvement in market conditions”
- By Steven Moore
- 17 April 2024, 07:50
De La Rue (#DLAR) – expects FY adj. Op profit “in line with guidance previously given, in the low £20m range”, intends ‘optimising intrinsic value’ update by end-May
- By Steven Moore
- 17 April 2024, 07:47
#SAGA – FY emphasises increased adj. profit but still statutory loss, net debt £637.2m
- By Steven Moore
- 17 April 2024, 07:42
ASOS (#ASC) – H1 increased loss on sales -18% YoY, though argues restructuring “progress” including appointment of new CFO Dave Murray
- By Steven Moore
- 17 April 2024, 07:36
M Winkworth (#WINK) – 2023 EPS -15% to 13p, DPS +6% to 11.7p, argues “excited by the outlook for the current year”
- By Steven Moore
- 17 April 2024, 07:29
Just Eat Takeaway.com (#JET) – Q1 gross transaction value -2% YoY, states reiterates full-year guidance
- By Steven Moore
- 17 April 2024, 07:23
Tuesday »
Fitch downgrades Petrofac to 'CC'; Removes RWN: this is damning
- By Tom Winnifrith
- 16 April 2024, 15:51
Hollywood Bowl – argues ‘strong growth’, but how “strong” really?…
- By Steven Moore
- 16 April 2024, 15:50
Tom Winnifrith Bearcast: The shocking sense of of entitlement of this prat from Wales
- By Tom Winnifrith
- 16 April 2024, 13:37
Marks Electrical – “a fast-growing online electrical retailer”… growing much more slowly now?…
- By Steven Moore
- 16 April 2024, 13:27
Superdry – more ouzo for the bears but time to close your short ahead of Julian Dunkerton "rescue" and delisting
- By Tom Winnifrith
- 16 April 2024, 12:19
Dr. Martens – trading warning & CEO Kenny Wilson has so much outlook “confidence”… that he’s decided to leave!
- By Steven Moore
- 16 April 2024, 11:05
UK Oil & Gas – Think the unthinkable, might its bailout placing fail?
- By Tom Winnifrith
- 16 April 2024, 09:38
Buy to the sound of gunfire and sell to the sound of trumpets (I've gone long bitcoin)
- By Steven Moore
- 16 April 2024, 09:03
Tom Winnifrith Bonus Bearcast: Ben's Creek Post Mortem, name the names of shame, learn the lessons
- By Tom Winnifrith
- 16 April 2024, 08:44
TClarke (#CTO) – recommended 160p per share offer from Regent Group
- By Steven Moore
- 16 April 2024, 07:57
DS Smith (#SMDS) – recommended 0.1285 International Paper Company shares per share offer
- By Steven Moore
- 16 April 2024, 07:53
Hostmore (#MORE) – proposed all-share reverse takeover of its franchisor TGI Fridays, Inc.
- By Steven Moore
- 16 April 2024, 07:49
Superdry (#SDRY) – proposed “restructuring plan”, equity raise and shares delisting
- By Steven Moore
- 16 April 2024, 07:45
Dr. Martens (#DOCS) – FY update and current “outlook is challenging”
- By Steven Moore
- 16 April 2024, 07:41
Sosandar (#SOS) – FY expects £0.2m loss, argues “several shops identified in top tier locations”
- By Steven Moore
- 16 April 2024, 07:37
Hollywood #BOWL – H1 notes revenue growth and “confident about the outlook for the business in FY”
- By Steven Moore
- 16 April 2024, 07:34
Robert Walters (#RWA) – Q1 constant currency net fees -16% YoY, “client and candidate confidence is at low levels”
- By Steven Moore
- 16 April 2024, 07:30
Hays (#HAS) – Q3 LFL net fees -14% YoY, “market conditions remained challenging through the quarter”
- By Steven Moore
- 16 April 2024, 07:27
B&M (#BME) – FY “volume growth led delivery at the top end of guidance”
- By Steven Moore
- 16 April 2024, 07:24
Monday »
BREAKING: Ben’s Creek US operations file for Chapter 11, shares a zero!
- By Tom Winnifrith
- 15 April 2024, 16:14
PageGroup – argues “resilient performance”, but are the declines really “resilient”?…
- By Steven Moore
- 15 April 2024, 16:07
Technology Minerals: shares fall another 10%, two explanations offered
- By Tom Winnifrith
- 15 April 2024, 14:08
Podcast: Cathal Friel and Aiden Lavelle of European Green Transition interviewed
- By ShareProphets
- 15 April 2024, 13:59
Wildcat Petroleum…oops a daisy, when will the FCA end this farce?
- By Tom Winnifrith
- 15 April 2024, 12:50
East Imperial – hopefully my refinancing warnings were heeded as now... “the company has ceased trading”!
- By Steven Moore
- 15 April 2024, 11:35
BREAKING EXPOSE: Alessandro Zamboni and Nuburu, the plot thickens
- By ShareProphets
- 15 April 2024, 09:44
Horizonte Minerals (#HZM) – “unable to secure interest in the full financing needed”, as warned here shareholders wipeout ahoy
- By Steven Moore
- 15 April 2024, 07:59
Wildcat Petroleum (#WCAT) – now unable currently to sign any sort of contract in Sudan, argues to “now concentrate on South Sudan”
- By Steven Moore
- 15 April 2024, 07:58
Invinity Energy Systems (#IES) – states expects to finalise ‘strategic investment agreements’ “in the coming weeks”
- By Steven Moore
- 15 April 2024, 07:55
Ceres Power (#CWR) – 2023 cash outflow £42.4m after revenue of £22.3m, “cash and short-term investments” £140m
- By Steven Moore
- 15 April 2024, 07:48
Audioboom (#BOOM) – argues improvement from 2023 results, but Q1 even adj. EBITDA profit just $0.1m
- By Steven Moore
- 15 April 2024, 07:45
Audioboom (#BOOM) – 2023 swing to even an adj. EBITDA loss, cash down to $3.7m
- By Steven Moore
- 15 April 2024, 07:42
Renold (#RNO) – now expects FY results “materially ahead of current market expectations”
- By Steven Moore
- 15 April 2024, 07:38
PageGroup (#PAGE) – Q1 gross profit -16.4% YoY, -12.8% in constant currency
- By Steven Moore
- 15 April 2024, 07:34
Inchcape (#INCH) – agreement to sell UK retail business for approx. £346m to Group 1 Automotive
- By Steven Moore
- 15 April 2024, 07:29
Synthomer (#SYNT) – agreement for sale of its Compounds business for c.€27.5m
- By Steven Moore
- 15 April 2024, 07:25
Sunday »
Tom Winnifrith Bearcast: what now for oil as Iran and Israel go head to head and why Neil Woodford is THE guilty man
- By Tom Winnifrith
- 14 April 2024, 17:34
The View From The Montana Log-Cabin As “Mr Slammy” Hits Gold Before Iran Strikes Israel
- By Nigel Somerville
- 14 April 2024, 08:33
Sunday Long Reads: Bringing Football to Sheffield, Art Fraud, Boeing, Self-Help, Biggest Cruise Ship Ever
- By ShareProphets
- 14 April 2024, 06:47
Notes from Underground – Most read articles for the week ending 13 April
- By ShareProphets
- 14 April 2024, 06:44
Saturday »
Lucian at 93% of target fundraise on his 63 mile walk for a great cause
- By Tom Winnifrith
- 13 April 2024, 21:09
Tom Winnifrith Bearcast: Wrexham up and my new least favourite football team, the gender pay gap, gold and bitcoin
- By Tom Winnifrith
- 13 April 2024, 21:09
Thoughts on Short Selling in the Post-Covid World and some safe targets
- By Steven Moore
- 13 April 2024, 12:30
Directa Plus – “GiPave installed at Imola Circuit”, RNS Reach attempted ramptastic?
- By Steven Moore
- 13 April 2024, 12:27
Why a Share Rise Could Be in the Pipeline for this Plumbing King.
- By Malcolm Stacey
- 13 April 2024, 12:25
Friday »
LifeSafe Holdings – “pleased to announce” appointment of new Nominated Adviser and broker. I wonder why!…
- By Steven Moore
- 12 April 2024, 14:15
Tom Winnifrith Bearcast: Petrofac is free money for the bears and does anyone advising Tern have any conscience?
- By Tom Winnifrith
- 12 April 2024, 14:04
Tern – After the preposterous and cynical pump……as things get Wyld
- By Nigel Somerville
- 12 April 2024, 09:25
GOTCHA! Ben’s Creek ‘fesses up that it's firing nearly all its workers! Does advisor Allenby give a FF about market rules
- By Tom Winnifrith
- 12 April 2024, 08:50
Oracle Power, David Lenigas and Mining Equities Pty Ltd: it’s a small world innit?
- By ShareProphets
- 12 April 2024, 08:17
REACT Group – contract wins including “three material contracts”, a trading momentum continuing Buy
- By Steven Moore
- 12 April 2024, 08:17
Photo Article: the proof that Chill Brands MUST be sitting on bad news about WH Smith
- By ShareProphets
- 12 April 2024, 08:14
iomart – “results which demonstrate the resilience of the group”. Er, do they?…
- By Steven Moore
- 12 April 2024, 08:13
Photo Article: a 2 metre reason NOT to go see my pal Vassilios Carellas on the ground with Arc Minerals in Zambia
- By ShareProphets
- 12 April 2024, 08:03
Bens Creek (#BEN) – GOTCHA! as admits “laid off 44 employees”, mine care and maintenance and in “additional financial support” discussions
- By Steven Moore
- 12 April 2024, 07:55
#TERN – placing raising just £0.42m at 2.4p per share, a more than 30% discount
- By Steven Moore
- 12 April 2024, 07:53
#TEAM – raises £1.25m at 20p per share as WRAP retail offer adds £0.14m
- By Steven Moore
- 12 April 2024, 07:51
Valereum (#VLRM) – “appointed Stanford Capital Partners Limited to act as the company's sole corporate broker with immediate effect”, hmmm!
- By Steven Moore
- 12 April 2024, 07:50
LifeSafe Holdings (#LIFS) – “appointment of Zeus Capital Limited as Nominated Adviser and Sole Broker with immediate effect”, hmmm!
- By Steven Moore
- 12 April 2024, 07:48
Roadside Real Estate (#ROAD) – “resource constraints at its auditors”, now expects to publish delayed results by 30th April
- By Steven Moore
- 12 April 2024, 07:45
Petrofac (#PFC) – “continues to face challenges in securing new performance guarantees”, discussions including for “a significant proportion of the debt being exchanged for equity”
- By Steven Moore
- 12 April 2024, 07:34
Premier Miton (#PMI) – Q2 AuM up to £10.712bn but still £268m of net outflows
- By Steven Moore
- 12 April 2024, 07:30
Huddled (#HUD) – acquisition of online retailer Food Circle Supermarket for £0.2m in cash and shares and up to a total £0.3m
- By Steven Moore
- 12 April 2024, 07:26
SigmaRoc (#SRC) – Q1 “underlying EBITDA in line with management's expectations”, integration of initial lime acquisitions “continuing well”
- By Steven Moore
- 12 April 2024, 07:21
BREAKING: FCA slams Neil Wooodford – worse to come for the disgraced fund manager we exposed
- By Tom Winnifrith
- 11 April 2024, 15:01
Bulletin Board moron seagreen where are you now? A posting that did not age well
- By ShareProphets
- 11 April 2024, 14:14
Distil – after in January “confident that we can continue to build on this growth in Q4”, now announces a Q4 sales slump!
- By Steven Moore
- 11 April 2024, 13:39
Blast from the past – Gable sues William Dewsall over alleged £20 million fraud
- By Tom Winnifrith
- 11 April 2024, 12:57
Alpha Financial Markets Consulting – expecting lower net fee income growth than stated just in February, but states “continues to expect”!
- By Steven Moore
- 11 April 2024, 10:55
Tiger Royalties – another quarter of pointless failure & meaningless data: premium to (undeclared) NAV is insane
- By Tom Winnifrith
- 11 April 2024, 10:23
BSF Enterprises – Frankenstein Leather, “No Current Plans For A Fundraise”.....Yeah, RIght, the annual report was a lie then?
- By Nigel Somerville
- 11 April 2024, 09:30
Ding Dong: for whom the discounted placing Bell tolls yet again
- By Tom Winnifrith
- 11 April 2024, 09:16
Tom Winnifrith Bonus Bearcast: thoughts on the £12.5m bailout of Revolution Bars at just 1p
- By Tom Winnifrith
- 11 April 2024, 08:03
BREAKING: Has Ben's Creek sacked all bar 5 of its staff? Statement needed asap
- By ShareProphets
- 11 April 2024, 08:03
The global warming nutters just make it up as they go along, Flooding in St Malo - Tom Winnifrith
- By Tom Winnifrith
- 11 April 2024, 08:00
Lok'nStore (#LOK) – recommended 1110p per share offer from Shurgard, the largest self-storage facilities business in Europe
- By Steven Moore
- 11 April 2024, 07:59
Red Rock Resources (#RRR) – another placing, £0.26m at 0.051p per share it states is including for developing gold assets in Burkina Faso
- By Steven Moore
- 11 April 2024, 07:55
Novacyt (#NCYT) – Lyn Rees appointed CEO, 2023 results delay “due to the time required to integrate the accounts of Yourgene Health”
- By Steven Moore
- 11 April 2024, 07:55
Distil (#DIS) – Q4 trading slump, notes spirits market “challenging” outlook
- By Steven Moore
- 11 April 2024, 07:49
Norcros (#NXR) – notes FY revenue decline “in a challenging demand environment”
- By Steven Moore
- 11 April 2024, 07:46
Iomart (#IOM) – FY update, notes growth held back by H2 lower than expected customer renewal rates
- By Steven Moore
- 11 April 2024, 07:43
Alpha Financial Markets Consulting (#AFM) – after February trading warning, “trading has improved through the rest of Q4, as expected”
- By Steven Moore
- 11 April 2024, 07:36
Polar Capital (#POLR) – FY AuM up to £21.892bn, quarterly swing to net inflows
- By Steven Moore
- 11 April 2024, 07:30
Domino's Pizza (#DOM) – completes acquisition of remaining, 85%, shareholding in its largest franchise business in Republic of Ireland and Northern Ireland
- By Steven Moore
- 11 April 2024, 07:24
Wednesday »
Churchill China – 2023 results, is it now “generating sustainable, growing returns for investors”?
- By Steven Moore
- 10 April 2024, 16:10
Tom Winnifrith Bearcast: IQE is still a quarter of a billion sell
- By Tom Winnifrith
- 10 April 2024, 15:42
XP Power – “trading in line with expectations”, but how much of an ‘achievement’ is that?…
- By Steven Moore
- 10 April 2024, 13:18
Futura Medical: unlike real customers, Lucian Miers gets a stiffy on the hidden warning
- By Tom Winnifrith
- 10 April 2024, 13:14
BREAKING: Another £70m AIM disaster as ETX announces plans to delist as it completes £28.9 million fund raise
- By Tom Winnifrith
- 10 April 2024, 11:29
Speedy Hire – “towards the lower end of the board's expectations”. Er, just how ‘low’ was that ‘lower end’ then?...
- By Steven Moore
- 10 April 2024, 11:14
Is your stockbroker a disabled transgender person of colour? It is awards time!
- By Tom Winnifrith
- 10 April 2024, 10:53
Cleantech Lithium – Roland “Fatty” Cornish actively signs off on deception as CEO hides dumping of his entire stake
- By Tom Winnifrith
- 10 April 2024, 10:37
UPDATED: Has Tesco caved to the Jew haters – I ask the question & it appears not
- By Tom Winnifrith
- 10 April 2024, 09:30
Direct Line Insurance (#DLG) – appointment of current CFO of UK and Ireland General Insurance business of Aviva (#AV.), Jane Poole, as CFO
- By Steven Moore
- 10 April 2024, 07:58
#THG – 2023 still a loss, argues “now delivering operating leverage”
- By Steven Moore
- 10 April 2024, 07:57
Tesco (#TSCO) – FY adj. EPS +14% to 23.41p, DPS +11% to 12.10p, argues “strong momentum”
- By Steven Moore
- 10 April 2024, 07:52
Treatt (#TET) – H1 improving performance, notes H2 “solid sales order book and healthy sales pipeline”
- By Steven Moore
- 10 April 2024, 07:49
M&C Saatchi (#SAA) – 2023 adj. EPS +3% to 15.2p, DPS +6% to 1.6p, “encouraging Q1 momentum”
- By Steven Moore
- 10 April 2024, 07:45
Churchill China (#CHH) – 2023 adj. EPS +5% to 70.2p, DPS +14% to 36p, softer demand continuing in H1 2024
- By Steven Moore
- 10 April 2024, 07:41
Speedy Hire (#SDY) – FY revenue -c.5%, expects results “towards the lower end of the board's expectations”
- By Steven Moore
- 10 April 2024, 07:37
Epwin (#EPWN) – 2023 adj. EPS +8% to 9.71p, DPS +8% to 4.80p, “expect to make further progress in 2024”
- By Steven Moore
- 10 April 2024, 07:33
XP Power (#XPP) – states Q1 “in line with expectations”… but that’s constant currency order intake -27% YoY and revenue -15%
- By Steven Moore
- 10 April 2024, 07:28
Tuesday »
Tom Winnifrith Bearcast: Should I care if Shell goes to America?
- By Tom Winnifrith
- 9 April 2024, 16:10
Gresham Technologies – how “pleased” to be with recommended offer?
- By Steven Moore
- 9 April 2024, 15:59
Tasty plc – requires “restructuring plan” including lease exits and creditor write-offs approvals, or it’s cash crunch ahoy!
- By Steven Moore
- 9 April 2024, 14:09
Explaining free speech with a cartoon for the 10th time for defamatory fantastist and liar Magna Carta
- By Tom Winnifrith
- 9 April 2024, 13:20
Tern: this is just a spoof, Talking Medicines “trading statement”
- By Tom Winnifrith
- 9 April 2024, 12:16
Surface Transforms – after another discounted equity fundraise as recently as November, surely it’s not liquidity crunch ahoy again?…
- By Steven Moore
- 9 April 2024, 11:10
Reader: You are being far too soft on Clem Chambers. I plead guilty, this is SHOCKING!
- By Tom Winnifrith
- 9 April 2024, 10:38
Clem Chambers trough-fest Online Blockchain Annual Report finally surfaces and it’s a hoot
- By Tom Winnifrith
- 9 April 2024, 08:09
Tom Winnifrith: Amnesty International eulogises the face of true evil, Walid Daqqa
- By Tom Winnifrith
- 9 April 2024, 08:00
Silver Bullet Data Services (#SBDS) – CFO Darren Poynton “stepping down”, Chris Ellis to join as CFO
- By Steven Moore
- 9 April 2024, 07:56
Helix Exploration (#HEX) – helium exploration company lists on AIM, raising a gross £7.5m at 10p per share
- By Steven Moore
- 9 April 2024, 07:55
ProCook (#PROC) – Q4 update, expects FY adj. PBT “marginally ahead” of expectations though at £0.5m-£1m
- By Steven Moore
- 9 April 2024, 07:48
Warpaint London (#W7L) – Q1 growth means now expects FY ahead of current expectations
- By Steven Moore
- 9 April 2024, 07:44
Ultimate Products (#ULTP) – H1 adj. EPS -3% to 8.3p, DPS +1% to 2.45p, “now seeing the gradual resumption of normal ordering patterns”
- By Steven Moore
- 9 April 2024, 07:41
Impax Asset Management (#IPX) – Q2 AUM up to £39.6bn, but net outflows of £1.7bn
- By Steven Moore
- 9 April 2024, 07:38
Renew (#RNWH) – acquisition of UK highways engineering business Route One for £5m Enterprise Value
- By Steven Moore
- 9 April 2024, 07:34
Aviva (#AV.) – completes acquisition of AIG's UK protection business for £453m
- By Steven Moore
- 9 April 2024, 07:28
HSBC (#HSBA) – agreement to sell business in Argentina for $550m subject to certain adjustments
- By Steven Moore
- 9 April 2024, 07:26
Monday »
Cake Box – “Full Year Trading Update”, why the profit and its comparatives that dare not speak their names?
- By Steven Moore
- 8 April 2024, 15:59
Tom Winnifrith Bearcast: the price of a loaf of bread was 26p in 1980 & I bet teachers were lazy then too
- By Tom Winnifrith
- 8 April 2024, 15:55
Tekmar – “Contract Awards”, but announcement RNS Reach attempted ramptastic?
- By Steven Moore
- 8 April 2024, 13:58
Video: From a Cyclical Low to a Super Bull – Why This Could be Gold’s Decade
- By Tom Winnifrith
- 8 April 2024, 13:31
Contango – from no plans to raise to a raise in just four months
- By Tom Winnifrith
- 8 April 2024, 13:16
Eden – how long will its cash last? Time for a Jo Hart mea culpa?
- By Tom Winnifrith
- 8 April 2024, 11:36
Windar Photonics – what’s the “proposed placing” really mainly for?…
- By Steven Moore
- 8 April 2024, 11:28
It was 11 years ago today that Britain's Greatest Leader passed away - a video tribute to Lady Thatcher, Tom Winnifrith
- By Tom Winnifrith
- 8 April 2024, 08:00
Peter Tatchell lives in an Orwellian post truth world when it comes to Russia and the Zaporizhzia nuclear power plant, Tom Winnifrith
- By Tom Winnifrith
- 8 April 2024, 08:00
CVS Group (#CVSG) – “cyber incident”, being investigated and “likely to have an impact on operations for a number of weeks”
- By Steven Moore
- 8 April 2024, 07:59
Bens Creek (#BEN) – notes a coal purchase order, but also that it is currently loss-making and is assessing “options available”
- By Steven Moore
- 8 April 2024, 07:59
European Green Transition (#EGT) – company developing “green economy assets” in Europe joins AIM, raising a gross £6.46m at 10p per share
- By Steven Moore
- 8 April 2024, 07:59
Emmerson (#EML) – $2.175m equity raise at 1.75p per share with warrants and a REX retail offer
- By Steven Moore
- 8 April 2024, 07:50
Windar Photonics (#WPHO) – proposed up to £4m placing at 35p per share, stated to be including after recent contract wins
- By Steven Moore
- 8 April 2024, 07:48
Cavendish Financial (#CAV) – appointment of Spark Advisory as Nominated Adviser, replacing Grant Thornton
- By Steven Moore
- 8 April 2024, 07:45
Cake Box (#CBOX) – expects FY revenue c.+9%, though also with 20 new stores taking estate to 225
- By Steven Moore
- 8 April 2024, 07:38
Bango (#BGO) – 2023 another loss, argues “strong” Q1 2024 but emphasising revenue
- By Steven Moore
- 8 April 2024, 07:31
Intercede (#IGP) – expects FY improved profitability from higher revenue and operational gearing
- By Steven Moore
- 8 April 2024, 07:27
Sunday »
Gender diversity boosts financial performance: the GroupThink lie that hurts us all.
- By Tom Winnifrith
- 7 April 2024, 19:13
Tom Winifrith Bearcast: Malcolm is 'avin' a Turkish if he thinks Lloyds is worth a quid
- By Tom Winnifrith
- 7 April 2024, 14:37
Sunday Long Reads: Farming Carauba, Woke Meltdown, Killer Culverts, Fighting the Metric System, Guinness World Records
- By ShareProphets
- 7 April 2024, 12:17
Gold Stocks – My Take On Why They’ve Still Got A Long Way To Go
- By Nigel Somerville
- 7 April 2024, 12:01
Notes from Underground – Most read articles for the week ending 6 April
- By ShareProphets
- 7 April 2024, 11:50
The Doom Goblin's Global Warming myth, data from Iceland, Dublin and Sweden the GroupThink cannot explain: Tom Winnifrith
- By Tom Winnifrith
- 7 April 2024, 00:01
Saturday »
Tom Winnifrith Bearcast: why are gold stocks we all own not even higher? Setting targets for a few I do own
- By Tom Winnifrith
- 6 April 2024, 19:54
Atalaya Mining - £4 Short-Term Tip Target Achieved: What To Do Now?
- By Nigel Somerville
- 6 April 2024, 19:26
Brand Architekts – interims, a significant discount to net assets Buy
- By Steven Moore
- 6 April 2024, 10:51
The View From The Montana Log-Cabin: “The (Gold) Bull Market Is Here, People – It’s Time To Make Money”
- By Nigel Somerville
- 6 April 2024, 10:48
Amaroq Minerals – first underground mining blast at Nalunaq, with further upcoming catalysts. Value BUY, More than 50% upside
- By Steven Moore
- 6 April 2024, 10:46
Looking Hard at Probably the most Traded Share in Blighty - and Asking Why?
- By Malcolm Stacey
- 6 April 2024, 09:05
Friday »
RUA Life Sciences – “Business Update” emphasise its “resilience and adeptness”, but is it just more ‘jam tomorrow’?
- By Steven Moore
- 5 April 2024, 16:29
Tom Winnifrith Bearcast: Happy Birthday Dad, he would have been 86 were he not in a better place
- By Tom Winnifrith
- 5 April 2024, 16:17
Xeros Technology – another of Neil Woodford’s disastrous ‘revolutionising’ picks… so “Fundraising” (materially discounted, natch)
- By Steven Moore
- 5 April 2024, 15:20
Video: The Economy is in Shambles, But Metals Are Still Heading Higher, silver to $100?
- By Tom Winnifrith
- 5 April 2024, 15:04
GOTCHAL: Red Rock Resource and a partial ’fess, Lenigas ramps again
- By ShareProphets
- 5 April 2024, 12:42
Argo Blockchain: Updates but as ever it is what it does not say that is the red flag
- By Tom Winnifrith
- 5 April 2024, 12:11
The FRAUD Supply@Me Capital: a weak and incomplete update fails to convince
- By Tom Winnifrith
- 5 April 2024, 10:56
Tom Winnifrith Bonus Bearcast: A tale of 2 non placings, discrediting management at Roquefort and Skinbiotherapeutics
- By Tom Winnifrith
- 5 April 2024, 09:10
Here we go again: is is market abuse or insider dealing at Roquefort? Will the FCA do anything?
- By ShareProphets
- 5 April 2024, 08:12
William Wragg, Grindr, The Honey Trap and the latest Tory sex scandal – I am so reminded of a Private Eye cartoon from 1963, Tom Winnifrith
- By Tom Winnifrith
- 5 April 2024, 08:00
Tom Winnifrith podcast: is the Trump Biden election now too close to call?
- By Tom Winnifrith
- 5 April 2024, 08:00
Video: LoveHamas ( I don't but its a good spoof) - Tom Winnifrith
- By Tom Winnifrith
- 5 April 2024, 08:00
Argo Blockchain (#ARB) – March “operational update”, emphasises increased “mining revenue” but no bottom-line details (natch!)
- By Steven Moore
- 5 April 2024, 07:59
Supply@ME Capital (#SYME) – attempted ramptastic “Business update”
- By Steven Moore
- 5 April 2024, 07:55
Wildcat Petroleum (#WCAT) – “Quarterly newsletter”, RNS Reach noting delays and ‘jam tomorrow’
- By Steven Moore
- 5 April 2024, 07:51
Red Rock Resources (#RRR) – “DRC and Gold Assets Update”, but only a “non-regulatory” RNS Reach
- By Steven Moore
- 5 April 2024, 07:49
SkinBioTherapeutics (#SBTX) – further shares issuance, and at just 6.592863p, as a result of terribly-structured Dermatonics acquisition
- By Steven Moore
- 5 April 2024, 07:46
Roquefort Therapeutics (#ROQ) – admits potential fundraise “market soundings”, but reckons “has decided to not proceed with any potential placing at this time”
- By Steven Moore
- 5 April 2024, 07:42
Alliance Pharma (#APH) – 2023 results delay due to auditor determining higher volume of work required than it originally expected
- By Steven Moore
- 5 April 2024, 07:39
Wincanton (#WIN) – CMA CGM offer lapses after the higher competing offer from GXO
- By Steven Moore
- 5 April 2024, 07:36
Pinewood Technologies (#PINE) – GM circular for 24.5p per share special dividend and a shares consolidation
- By Steven Moore
- 5 April 2024, 07:31
Deliveroo (#ROO) – ‘B’ shares conversion, to have just one class of shares in issue
- By Steven Moore
- 5 April 2024, 07:26
Tom Winnifrith Bearcast: meeting Olaf's b/f, smelly cheese PLC and an admission I was wrong
- By Tom Winnifrith
- 4 April 2024, 16:47
Motorpoint – emphasises recent trading improvement and outlook optimism, but how much is already priced-in?…
- By Steven Moore
- 4 April 2024, 16:20
If Zamboni’s Avantgarde has not sold any shares in Supply@ME Capital I am a Dutchman
- By Tom Winnifrith
- 4 April 2024, 14:49
Gelion – emphasises “key technology proof point” milestone achieved. Er, what about that update on “solvency/viability and long-term future”?
- By Steven Moore
- 4 April 2024, 13:36
Cirata ( Wandisco as was) from $30m fund raise to material uncertainty and a warning in just nine months!
- By Tom Winnifrith
- 4 April 2024, 12:20
Insig AI – “equity funding facility” agreement, though forget it enabling meaningful “investment into sales and marketing”?
- By Steven Moore
- 4 April 2024, 11:38
The curse of Swanny strikes again, bucket shop placing at Genflow, the company created by a penny share fraudster
- By Tom Winnifrith
- 4 April 2024, 10:49
Another old friend lost? I am a “fascist” for not slating the Jews: Tom Winnifrith
- By Tom Winnifrith
- 4 April 2024, 08:00
DS Smith (#SMDS) – “continuing discussions with Mondi”, Takeovers Panel extension to 5pm 23rd April
- By Steven Moore
- 4 April 2024, 07:59
Genflow Biosciences (#GENF) – £0.715m placing at 1.25p per share, with warrants
- By Steven Moore
- 4 April 2024, 07:59
Supply@ME Capital (#SYME) – insists Alessandro Zamboni not selling shares
- By Steven Moore
- 4 April 2024, 07:57
Lords Group Trading (#LORD) – appointment of Stuart Kilpatrick as CFO to succeed leaving “to take up another professional opportunity” Chris Day
- By Steven Moore
- 4 April 2024, 07:51
Cavendish Financial (#CAV) – “trading update” notes revenue growth but no other P&L detail, cash up to £20.8m
- By Steven Moore
- 4 April 2024, 07:46
Motorpoint (#MOTR) – Q4 retail volume +c.9% YoY and continued margin recovery, though still a full-year loss
- By Steven Moore
- 4 April 2024, 07:43
Future (#FUTR) – “return to organic revenue growth in Q2”, currently “on-track to deliver on expectations for FY”
- By Steven Moore
- 4 April 2024, 07:39
Gooch & Housego (#GHH) – H1 impacted by some destocking, argues expects trading to be more heavily weighted towards H2
- By Steven Moore
- 4 April 2024, 07:36
GetBusy (#GETB) – acquisition of accounting “pricing intelligence and revenue optimisation” platform SmartPath for initial $0.25m and contingent consideration up to $2m
- By Steven Moore
- 4 April 2024, 07:32
Eco Animal Health (#EAH) – disposal of “non-core” branded treatment for equine parasites for a total €1.3 million
- By Steven Moore
- 4 April 2024, 07:28
Wednesday »
Calnex Solutions – “broadly in line with” (i.e. a bit behind) expectations… which it dare not mention were already massively reduced!
- By Steven Moore
- 3 April 2024, 16:05
Video: Will Gold & Silver Prices Soar in a 2008-Style Economic Collapse?
- By Tom Winnifrith
- 3 April 2024, 15:40
Tom Winnifrith Bearcast: Any company even suspected of round tripping is just not investable
- By Tom Winnifrith
- 3 April 2024, 15:27
Topps Tiles – “First Half Trading Update” is a profit warning that dare not speak its name…
- By Steven Moore
- 3 April 2024, 13:47
Trakm8 Holdings: The Pig, The Pork and the debt at credit card rates
- By Tom Winnifrith
- 3 April 2024, 13:33
Tom Winnifrith Bonus Bearcast: Fundamental analysis just does not matter any more and it is wrong to short Trump Media as a result. Discuss
- By Tom Winnifrith
- 3 April 2024, 12:30
Shearwater – “FY24 Trading Update” is a material lack-of-profit warning after the year-end!
- By Steven Moore
- 3 April 2024, 11:09
Letter to Roland “Fatty” Cornish: how can you allow this social media outrage and AIM Rule Breaking at Red Rock?
- By Tom Winnifrith
- 3 April 2024, 08:02
DISGRACE: Advanced Oncotherapy – Beyond A Joke As AIM Continues To Break Its Own Rules
- By Nigel Somerville
- 3 April 2024, 08:02
Alpha Group International (#ALPH) – intends to move to Main Market from AIM
- By Steven Moore
- 3 April 2024, 07:59
Trakm8 (#TRAK) – ramptastic update, though also including issue of £0.99m of 18% interest convertible loan notes!
- By Steven Moore
- 3 April 2024, 07:58
#PEEL Hunt – FY revenue c.+4% and a loss, notes UK economic and fund flows challenges
- By Steven Moore
- 3 April 2024, 07:58
#WIZZ Air – March booked passengers +12% YoY, load factor -1.3ppts to 90.8%
- By Steven Moore
- 3 April 2024, 07:53
Shearwater (#SWG) – larger contracts agreement delays warning, argues during this year “confidence in returning to growth”
- By Steven Moore
- 3 April 2024, 07:46
Calnex Solutions (#CLX) – expects FY “broadly in line” (i.e. slightly behind) expectations, argues expects to return to growth this year
- By Steven Moore
- 3 April 2024, 07:41
Topps Tiles (#TPT) – H1 sales -5.9% YoY, particularly notes subdued domestic RMI demand especially for bigger ticket projects
- By Steven Moore
- 3 April 2024, 07:38
Hilton Food (#HFG) – 2023 adj. EPS up to 52.8p, DPS to 32p, argues “well placed… although markets remain challenging”
- By Steven Moore
- 3 April 2024, 07:32
AB Dynamics (#ABDP) – acquisition of Venshure Test Services for initial $15m and further contingent up to $15m
- By Steven Moore
- 3 April 2024, 07:28
Spectris (#SXS) – completes sale of Red Lion Controls business for estimated net proceeds of c.$275m
- By Steven Moore
- 3 April 2024, 07:24
Tuesday »
Shameless David Lenigas: his second most ramptastic tweet in history
- By ShareProphets
- 2 April 2024, 15:54
Zenova – director “pivotal” in its products development leaves “with immediate effect”. Uh oh!…
- By Steven Moore
- 2 April 2024, 15:52
Tom Winnifrith Bearcast: this RedX news is a total disaster for the AIM Casino, preparing to meet Olaf's b/f after a year
- By Tom Winnifrith
- 2 April 2024, 15:23
Itaconix – “unable to reach satisfactory commercial terms with one of its major existing merchandizing customers”. Uh oh!…
- By Steven Moore
- 2 April 2024, 13:39
A checklist of share price doom from Evil Banksta as he prepares for a luxury break
- By Tom Winnifrith
- 2 April 2024, 12:52
Tom Winnifrith Bonus Bearcast: Why Steve and I cannot give investment advice on Bluebird Merchant today, a clear own goal
- By Tom Winnifrith
- 2 April 2024, 11:23
Sondrel – argues requires “transformation” away from AIM listing… having listed less than 18 months ago!
- By Steven Moore
- 2 April 2024, 11:14
Donald J. Trump offers a slam dunk short but also a long: here is the pair trade
- By Tom Winnifrith
- 2 April 2024, 10:33
Belluscura: wrong, wrong, wrong – not 1 but 2 lack of profits warnings!
- By Tom Winnifrith
- 2 April 2024, 10:09
Revolution Bars (#RBG) – “unable to publish” results shares suspension, desperate fundraising discussions
- By Steven Moore
- 2 April 2024, 07:57
Horizonte Minerals (#HZM) – senior lenders waivers to end-April, working on “a restructuring plan” requiring creditors approval
- By Steven Moore
- 2 April 2024, 07:52
Bluebird Merchant Ventures (#BMV) – Gubong project “partial farm out” agreement discussions, Kochang project audit and inspection process review “still being processed”
- By Steven Moore
- 2 April 2024, 07:48
UK Oil & Gas (#UKOG) – FY £4m loss on revenue down to £1.5m and swing to net debt
- By Steven Moore
- 2 April 2024, 07:44
Frontier Developments (#FDEV) – sales “in-line with expectations”, disposal of Rollercoaster Tycoon for $4m and $3m deferred consideration
- By Steven Moore
- 2 April 2024, 07:40
Gaming Realms (#GMR) – 2023 EPS up to 2p, “promising start to 2024”
- By Steven Moore
- 2 April 2024, 07:36
Mission Group (#TMG) – 2023 swing to loss and increased net debt, argues current year “trading has started well”
- By Steven Moore
- 2 April 2024, 07:32
Renew (#RNWH) – “continues to experience strong demand… across all key markets”, Rail sector director change
- By Steven Moore
- 2 April 2024, 07:28
HSBC (#HSBA) – completes sale of Canada business to RBC, intends special dividend per share of $0.21
- By Steven Moore
- 2 April 2024, 07:24
Monday »
If you send me emails or private messages insulting & defaming me why do you expect a response?
- By Tom Winnifrith
- 1 April 2024, 19:38
Tom Winnifrith Bearcast: An in depth deep dive into AI spoof CEL.AI ( Cellular Goods as was)
- By Tom Winnifrith
- 1 April 2024, 19:21
ShareProphets readers tips for 2024 prize competition – end-March update
- By Steven Moore
- 1 April 2024, 13:25
Nightcap – will tube strikes be the straw that breaks the camels back, insolvency in Q2 suggests an insider
- By Tom Winnifrith
- 1 April 2024, 12:17
Exclusive: Cavendish Financial to list £50m LGBTQA+ investment company on AIM
- By Tom Winnifrith
- 1 April 2024, 09:58
Getting a barrage of hate for stating a fact, meet the #NAFO loons - Tom Winnifrith
- By Tom Winnifrith
- 1 April 2024, 02:12
Sunday »
Tom Winnifrith Bearcast: Calm down Nigel old boy, If $4000 does happen we are all fecked
- By Tom Winnifrith
- 31 March 2024, 17:10
The View From The Montana Log-Cabin As Gold Powers Further Ahead
- By Nigel Somerville
- 31 March 2024, 14:17
Johnson Matthey continues to streamline its business and looks set for growth going forwards - buy
- By Gary Newman
- 31 March 2024, 12:44
Visual Aid: Luxury Goods Investments vs. S&P 500 in the Last 10 Years
- By ShareProphets
- 31 March 2024, 12:39
Sunday Long Reads: Lululemon vs Muscular Dystrophy, Putin’s Prisoners, Sadiq Khan Conspiracy, 1719 London Letters
- By ShareProphets
- 31 March 2024, 12:38
Notes from Underground – Most read articles for the week ending 30 March
- By ShareProphets
- 31 March 2024, 12:37
Tom Winnifrith podcast: Russia, Ukraine and USA and a flashback to Syria and how we were lied to then
- By Tom Winnifrith
- 31 March 2024, 00:01
Saturday »
On the fence pro tem but I am sure Avacta shares will collapse at some point
- By Tom Winnifrith
- 30 March 2024, 19:14
Tom Winnifrith Bearcast: the bitcoin bubble or not as we are told to celebrate not Easter but transgender awareness day tomorrow
- By Tom Winnifrith
- 30 March 2024, 17:52
Professor Malcolm Stacey's Never-to-be Missed World Renowned and Widely Acclaimed Easter Lecture.
- By Malcolm Stacey
- 30 March 2024, 09:47
Friday »
Tom Winnifrith Bearcast: Companies I am reporting to the FRC this weekend
- By Tom Winnifrith
- 29 March 2024, 12:04
EXPOSE: Versarien dire year end numbers and a slam dunk case for the FRC
- By Tom Winnifrith
- 29 March 2024, 11:14
DETAILED EXPOSE of RegTech Open Project – Piss poor interims are materially non-compliant with IFRS
- By Tom Winnifrith
- 29 March 2024, 05:40
Thursday »
Horizonte – the game is now up, sell while you can, this is a 0p stock
- By Tom Winnifrith
- 28 March 2024, 22:52
B.P. Marsh & Partners – a new investment, a sale and a dividend declaration
- By Steven Moore
- 28 March 2024, 22:52
Superdry after hours ‘fess up – this looks like a zero, its the most obvious short in town on Tuesday morning
- By Tom Winnifrith
- 28 March 2024, 22:51
Pebble Beach Systems – 2023 results “an outstanding outcome”, Buy
- By Steven Moore
- 28 March 2024, 22:51
Steve O'Hara emails – Has Boots given us the boot? As another ADVFN knob tells lies
- By Tom Winnifrith
- 28 March 2024, 22:51
Tom Winnifrith Video Shareshow No 35: bear raider Lucian Miers and Steve O'Hara of Optibiotix
- By Tom Winnifrith
- 28 March 2024, 15:23
Tom Winnifrith Bearcast: Amigo pulls the Jesus Easter trick but 2 others don't recover from AIM Crucifixion
- By Tom Winnifrith
- 28 March 2024, 15:22
AO World – emphasises delivering on pivot of “focus to profit and cash generation”, but sufficiently for the valuation?…
- By Steven Moore
- 28 March 2024, 14:49
Weak results at Wyld Networks, a double whammy for Tern on the way
- By Tom Winnifrith
- 28 March 2024, 13:15
Golden Prospect Precious Metals – 2023 results, an again increasingly favourable gold environment Buy
- By Steven Moore
- 28 March 2024, 10:23
GOTCHA: Sareum placing and retail offer at just 10p, for morons and financial masochists only
- By Tom Winnifrith
- 28 March 2024, 10:22
Amaroq Minerals – 2023 results, an upcoming production and exploration excitement BUY
- By Steven Moore
- 28 March 2024, 09:29
The Supply@ME Capital FRAUD – 2 more developments that make no sense at all, go ask Alice
- By Tom Winnifrith
- 28 March 2024, 09:16
How Different Warwick School is these days – but what on earth is the CPS doing with regard to paedophile ex-teachers? Tom Winnifrith
- By Tom Winnifrith
- 28 March 2024, 08:00
Versarien (#VRS) – FY ended 30th September 2023 even adj. loss of £5.5m and already then net debt!
- By Steven Moore
- 28 March 2024, 07:59
Argo Blockchain (#ARB) – completes desperate sale of Quebec data center for $6.1m, noted debt $54m
- By Steven Moore
- 28 March 2024, 07:53
Molecular Energies (#MEN) – ANOTHER proposed cancellation from AIM
- By Steven Moore
- 28 March 2024, 07:49
Byotrol (#BYOT) – year-end trading update and proposed cancellation from AIM
- By Steven Moore
- 28 March 2024, 07:48
#QUIZ – challenging trading and “ongoing” ‘strategic review’, founder CEO Tarak Ramzan to move to NED role and be replaced by CCO Sheraz Ramzan
- By Steven Moore
- 28 March 2024, 07:43
JD Sports Fashion (#JD.) – FY LFL sales +4.2% though Q4 just +0.1%, “trading environment remains challenging”
- By Steven Moore
- 28 March 2024, 07:39
AO World (#AO.) – ‘positive’ trading expected to mean FY adj. PBT “at least at the top of the previously guided range of £28-£33m”
- By Steven Moore
- 28 March 2024, 07:36
James Latham (#LTHM) – FY sales volumes “very similar to the previous year”, anticipates PBT “in line with market expectations”
- By Steven Moore
- 28 March 2024, 07:32
Kitwave (#KITW) – acquisition of North England food wholesaler Total Foodservice Solutions for a net c.£17m
- By Steven Moore
- 28 March 2024, 07:29
#888 Holdings – exiting US B2C operations, including sale agreement for selected assets
- By Steven Moore
- 28 March 2024, 07:26
Wednesday »
Gelion – interims argue “confident… well positioned to continue developing relevant energy storage solutions”. Is it though?…
- By Steven Moore
- 27 March 2024, 14:29
GOTCHA! Technology Minerals – why interims and year accounts need to be restated to consolidate Recyclus Group, shares must be suspended NOW
- By ShareProphets
- 27 March 2024, 13:47
Solid State – results “expected to be ahead of consensus expectations”, but how sustainably?…
- By Steven Moore
- 27 March 2024, 11:35
Braemar – full-year “in line with market expectations”, remains a value BUY
- By Steven Moore
- 27 March 2024, 11:24
The fraud Supply@ME issues another 1.5 billion worthless shares to Zamboni: more smoke and mirrors vicar?
- By Tom Winnifrith
- 27 March 2024, 11:23
Kefi Gold & Copper – General Meeting statement, “material milestones” ahead
- By Steven Moore
- 27 March 2024, 09:24
Put the kettle on, it’s another disastrous trading statement from Strix containing a blatant porky
- By Tom Winnifrith
- 27 March 2024, 09:23
Technology Minerals (#TM1) – H1 loss £1.5m and already net debt, hence agreeing subsequent death spiral financing facilities
- By Steven Moore
- 27 March 2024, 07:58
Travis Perkins (#TPK) – CEO Nick Roberts to ‘step down’, “the board and Nick are aligned that now is the right time to search for a new leader”. Hmmm!
- By Steven Moore
- 27 March 2024, 07:53
Artisanal Spirits (#ART) – emphasises 2023 “revenue growth and adjusted EBITDA profit”, but increases bottom-line loss
- By Steven Moore
- 27 March 2024, 07:50
Revolution Beauty (#REVB) – now expects FY adj. EBITDA slightly above previous guidance, argues “seeing positive impacts from the new strategy”
- By Steven Moore
- 27 March 2024, 07:47
CMC Markets (#CMCX) – continued positive trading momentum means now expects FY net operating income above previously-guided range
- By Steven Moore
- 27 March 2024, 07:43
Strix (#KETL) – 2023 adj. EPS down to 9.2p, DPS axed as also net debt £83.7m
- By Steven Moore
- 27 March 2024, 07:39
S4 Capital (#SFOR) – 2023 another loss on lower revenue, “expect clients to remain cautious in the near term”
- By Steven Moore
- 27 March 2024, 07:36
Quartix Technologies (#QTX) – Q1 new unit subscriptions expected to be approx. +10% YoY, CFO Emily Rees resigns “to pursue opportunities outside the company”
- By Steven Moore
- 27 March 2024, 07:34
Solid State (#SOLI) – “acceleration of revenues” means expects FY “ahead of consensus”, but “reflected commensurately” in next year’s expectations
- By Steven Moore
- 27 March 2024, 07:30
James Halstead (#JHD) – H1 EPS up to 4.8p, DPS to 2.5p, performance continuing in early months of H2
- By Steven Moore
- 27 March 2024, 07:25
Tuesday »
Ariana Resources – Resource And Reserves Update Which Poses Me Questions, But Still A Buy
- By Nigel Somerville
- 26 March 2024, 16:37
Time left: 01:41:48